

Do You Know Why and How?
Neighborhood Analysis is something that every appraiser uses in developing their appraisals. But how many of them are using it correctly? How many of them understand it? As an appraiser, do YOU understand why you should thoroughly grasp how Neighborhood Analysis work? If not, keep reading and we’ll share some insights about this important part of the appraisal process! We draw on a webinar by The Appraiser’s Advocate, Tim Andersen, DataMaster’s Chief Appraiser, Jared Preisler, and hosted by DataMaster’s chief marketer, Marty Hamilton.
Why Should You Understand?

It’s common knowledge that all appraisers use tools to complete their appraisals. But do all appraisers understand those tools, why the tools are used in specific circumstances, and how the tools actually work as they provide data to an appraiser?
As Jared explains:
Advisory Opinion 37 deals with computer assisted valuation tools. It can be the sketching tool, the laser measure, the multiple regression analysis tool, etc. To conform with Advisory Opinion 37, appraisers need to understand the tools that they’re using. As an appraiser uses Neighborhood Analysis, they need to understand how it works and what type of data makes it work. Not every tool will work in every market, as there are regional nuances, etc.
As a successful appraiser, it’s imperative that you understand the ins and outs of the tools that you use! This need is illustrated with an example from Tim.
Tim shared a story about some appraisers who bought some regression analysis software, started using it without understanding it, used the software inappropriately, and got called before the state board. The appraisers were chastised by the board and instructed that it was their responsibility to understand the tool better (and any other appraisal tools that they used!). They needed to do their part and learn how the tool worked before using it to come to conclusions in an appraisal that they signed their names to.
Tim gives appraisers three tips when considering a tool to use in the appraisal creation process:
- Know what the tool is and what it does.
- Know how to use it.
- Understand if the tool really helps you answer the question.
Do you doubt that you thoroughly understand the tools that you use? We’re here to help, and today we’re discussing Neighborhood Analysis with the intention of giving you the understanding of how the tool works in DataMaster and how it will help you create a defensible Neighborhood Analysis!
What Neighborhood Analysis Does
Anytime DataMaster’s new Neighborhood Analysis tool is discussed in our office, Jared’s excitement is clearly evident! As our Chief Appraiser, Jared is heavily involved with developing our appraisal tools and is extremely excited about this newly released tool!
Neighborhood Analysis by DataMaster has been meticulously developed and tested by Jared along with our development teams and other appraisers who work in our office, including our president and CEO, Rick Lifferth. Trust us, this tool is exactly what any successful, driven appraiser is looking for because it was developed by active, wildly successful appraisers! (For more insight into DataMaster, hop over to “Let the Appraiser Decide” and learn more about what DataMaster does for appraisers!)
Why is this tool so exciting to Jared and the other appraisers in our office? Because the tool keeps the appraiser in control of the data, saves them even more time on each appraisal, and packs impressive capabilities that benefit you, the appraiser. Let’s delve into those capabilities! We’re sure you’re going to be impressed!
The Details
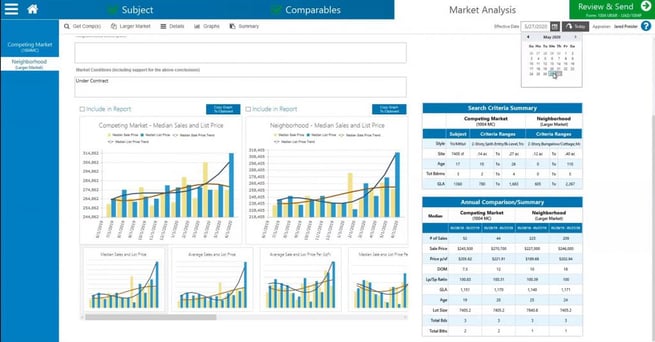
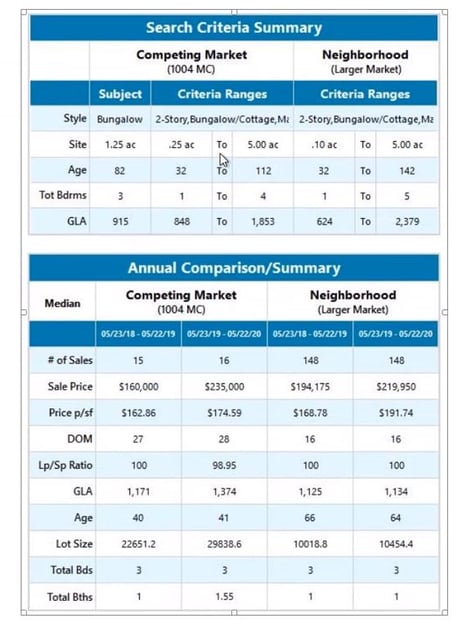
Neighborhood Analysis by DataMaster works as the appraiser feeds their data into DataMaster. The appraiser defines the market to the tool. DataMaster then segments and compares the two contrasting datasets, whether they are from a tight competing market or a broader neighborhood, or two-stories versus ramblers, etc. The tool allows the appraiser the flexibility of mimicking whatever the market is.
One example of how this would be used if if you have a new builder that decides to build a new project and that project is using the exact same models that the builder built in a different area. The older area is selling right now, so an appraiser might have to compare the two competing markets to each other to come up with a location difference. Jared exclaims:
This tool would be dynamic, it would be fantastic for me to use it here! I could bring the two markets up, compare them, and show what the location difference is!
Next, DataMaster presents the comparison between the two markets. The comparison will show one or two years of data month to month or up to six years quarterly.
The appraiser then compares the information, and with DataMaster’s help, analyzes the data. One quick note, the appraiser can import all of the data that they want to import, there’s no limit!
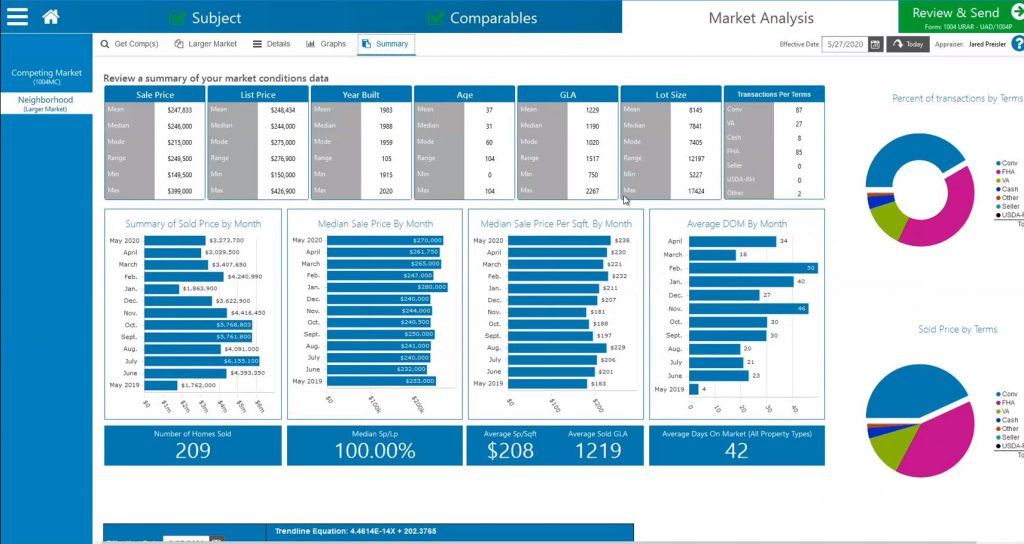
Neighborhood Analysis by DataMaster was built to GSE standards, yet another benefit of this extremely helpful tool. Once the appropriate data is chosen by the appraiser, the tool fills out the required forms and provides meaningful graphs (28 to choose from!) and statistics. The appraiser then customizes the reports, saving time and creating a solid, defensible file which is automatically saved for future reference.
Do you need a little more convincing? Jared Preisler praises Neighborhood Analysis by DataMaster and explains why it’s so important!
This tool will help the appraiser make better trending decisions. DataMaster gives the appraiser all of the information that they need, presented in a way that’s better for the appraiser to digest than is presented elsewhere. Also, when the appraiser hits “Send to Report,” all of the information in the Neighborhood Analysis gets saved in the appraiser’s archive! Many appraisers don’t save their Neighborhood Analysis, a USPAP violation, so having the analysis automatically saved is a huge plus for appraisers!
And that’s how Neighborhood Analysis by DataMaster works! We’re so excited for this new tool, and we know that you’ll love it! It’s amazing!
A Little Something About Neighborhood Analysis

With the heavy-duty lifting done, we’d like to give you a bonus tidbit, an insight from Tim on how to ensure that your Neighborhood Analysis is thorough.
Taking the time to investigate environmental forces can pay off in the creation of an appraisal report that misses nothing. You need to think of every little thing that might have an impact on a property, including ghosts!
Years ago, Tim was asked by a friend to help him appraise a commercial property in Key West, Florida. The property was a gorgeous B&B on nearly an acre of land. Myriad plants and trees dampened most of the noise around them, other than the occasional airplane passing overhead. The main building was built post-Civil War out of high-quality oak that had superbly withstood the test of time. The venerable home showed off beautiful, high ceilings and quality workmanship. More buildings had been added to the property over the last century to create more traditional hotel-style rooms.
Not only was the building unique and magnificent, the property surrounding the B&B had been declared a botanical sanctuary by the University of Florida.
There was much to see and discuss as the B&B manager proudly showed Tim and his friend the lush grounds.
After touring and conversing a while, Tim off-handedly asked if the property was haunted. Surprised that Tim would ask, the manager said that the original builder of the home actually still lived there and haunted her bedroom! The ghost reportedly folded clothes in her old bedroom while the guests were out! This strange environmental factor was actually a plus for many guests, bringing customers to the B&B with the hopes of a glimpse of the specter!
Tim’s point in relating the story was that as an appraiser, you should ask questions, dig into the nuances of the local area. You must know the history, what businesses are coming in and bringing jobs or going out and taking jobs, if the comps that were previously used are still relevant, if the population is aging or on the young side, and are there oddities such as ghosts that might draw in visitors (or chase them away), etc.?
Wrapping It Up
Tim’s ghost story is a good example of the depths that a good Neighborhood Analysis must go to. Just remember, DataMaster is here to help! We’re always working on improving the work process for appraisers. Neighborhood Analysis is something we’re so excited about (if you can’t tell). Along with CompTracker, we feel like we’ve outdone ourselves this year in offering appraisers tools that will propel them forward by enabling them to complete their appraisals faster, thoroughly, accurately, and defensibly! Remember, we develop our tools with explicit input from active, successful appraisers who are involved with the creation, development, and fine-tuning of the finished product! These tools are developed for you, the appraiser!
We appreciate Tim Andersen for taking the time to join Jared Preisler and host Marty Hamilton for our Neighborhood Analysis webinar, which this blog post is based on. If you’d like to see their discussion in more detail, go to the webinar link here: https://event.webinarjam.com/channel/Neighborhood.
To get Tim’s ebook go to: TheAppraisersAdvocate.com/product or email him at: Tim@theappraisersadvocate.com.
Thanks for reading, and Happy Appraising!